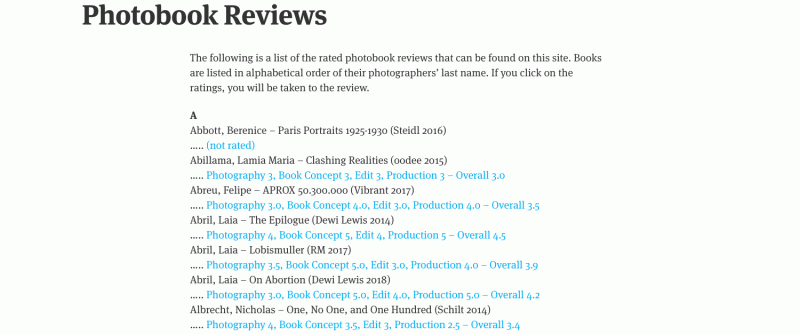
In 2014, I added ratings to my photobook reviews. Ratings are very common for, let’s say, reviews of movies, music, or books. But in the world of photography they were and still are not very common at all. I was aware of the possible pitfall of people scrolling down to the rating without reading the review. But then, the rating I came up with has four components. So even if someone doesn’t read the review text, they still will get some idea of what it might say based on those numbers.
Whatever you, as the reader, might make of the ratings, for sure they have changed the way I approach photobooks. In fact, they have made me look more carefully, and they have also created a more level playing field. While the details of the ratings could be discussed — I thought about refining them until I realized that there would never be such a thing as perfect ratings, their structure forces me to look at every book in the same way.
It would seem that that’s what critics should do, look at everything in the same, dispassionate way. Maybe there are critics who can effortlessly do that. But this particular critic is a human being, and as such I have my moods, my preferences, my stereotypes, in other words my all-too-human failings that interfere with what I do as much as they can.
The ratings pull me back to looking at aspects that I should be looking at, however I initially approach a book. Quite often, they have made me engage with a book differently, often, but not always, changing the review itself. So I feel that the ratings have made me a better critic. Whether or not this is something you, as a reader, have noticed I have no way of knowing. But I hope so.

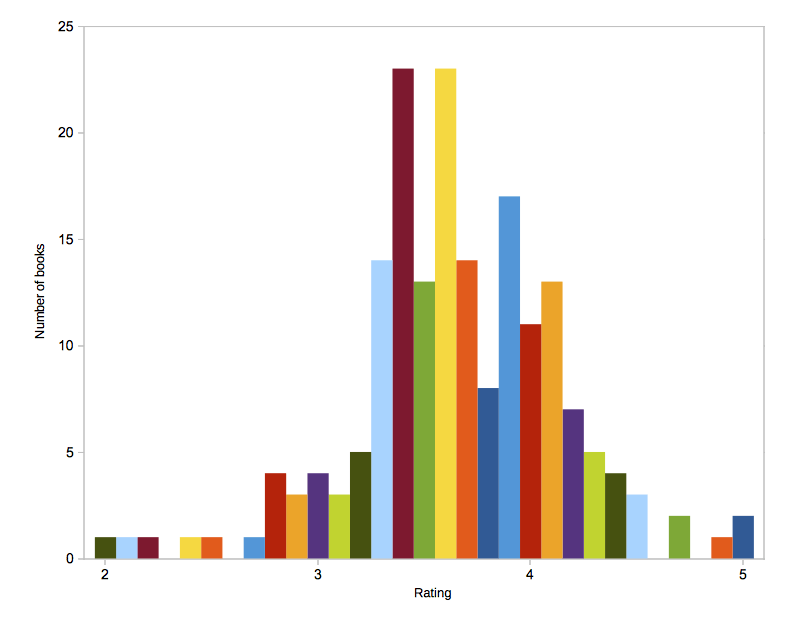
I left the sciences a decade ago, but there’s enough of a scientist in me to wonder whether some of the more basic ideas that went into the ratings have actually played out. At the time of this writing (June 4th, 2018), there are 185 book reviews with ratings on this site. That’s enough books to look at some statistics. With the help of some basic spread-sheet software, I tallied the ratings — you can see the graph above.
What you see is a distribution that more or less follows a bell curve, which peaks somewhere around 3.5 or 3.6 maybe (actually, a log-normal distribution might be a better fit, but I’m not going to geek out on this idea). The former scientist in me thinks that this might support the general idea I started out with: average books should be most common and lousy or great ones rare. If, however, you take the ratings completely seriously you’d expect the peak to center on exactly 3.0. Why is the peak shifted to higher numbers? Also, the distribution isn’t really fully symmetric — it falls more rapidly towards lower numbers than towards higher ones. Why is that?
I think the reason is simple and pretty obvious. It’s no secret that every year, many new photobooks are being published. A lot of them are very good, a lot of them are very bad. Reviewing a bad book gives me no pleasure, so in many cases I simply don’t do it (I’d like to think that the fact that photoland has problems with negative reviews does not enter into my thinking). In particular, if a not very well known photographer publishes a book I really don’t like I prefer not to review it instead of potentially hurting their career.
In addition, I have my preferences of what I look at; and while I’m trying to move beyond that when reviewing books, there still are certain books that I simply don’t review because I’m not interested in them. I think it’s the combination of those two factors that produces the peak at a higher number (around 3.5 or 3.6) than the theoretical average (3.0).
Given the above, I’ll keep with my ratings. They might not be perfect, but for sure they help me as a critic. And in their entirety, they reflect my thinking around photobooks. So now onto the next 185 photobooks (and beyond)…
